I was working through vector retrieval scoring and kept coming back to the same question: when my vector database returns a score like 0.937, is that a percentage? The short answer is no. That number is the value from your index metric, not a percentage. So the interpretation depends on whether your index is using cosine similarity, dot product, or euclidean distance.
Strictly speaking, cosine and dot product are similarity measures, while euclidean is a distance metric, and none of them are the full retrieval pipeline. There are other retrieval approaches too like ANN indexing methods, hybrid keyword + vector search, metadata filters, and reranking. However cosine, dot product and euclidean metrics are the most common starting point in vector databases so I focused on them as I dont know, what I dont know 🙈 🙉 🙊
How to read retrieval scores
If vectors are L2-normalized (common in embedding pipelines), dot product behaves like cosine for ranking and its values fall into the [-1, 1] range. With unit-normalized vectors, Euclidean distance is bounded from 0 to 2.
So if a cosine index returns 0.937, I read that as high similarity, not 93.7%. I also keep this comparison handy when I am reading retrieval scores:
| Cosine | Euclidean | Dot product | |
|---|---|---|---|
| What it measures | Directional alignment between vectors | Straight-line distance between points | Alignment plus magnitude |
| Formula | cos(theta) = (a . b) / (norm(a) * norm(b)) |
d(a, b) = sqrt((x_b - x_a)^2 + (y_b - y_a)^2) |
dot(a, b) = a . b |
| Value range | [-1, 1] |
[0, infinity) |
Unbounded |
| Better score | Higher | Lower | Higher |
| Sensitive to magnitude | Mostly no (focuses on direction) | Yes | Yes |
| Typical retrieval question | “How aligned are these meanings?” | “How close are these points?” | “How aligned are these vectors, weighted by size?” |
In the examples below, Cosine and Euclidean both surfaced tiger, cat, mouse as the top-3 for lion.
Dot product also surfaced the same set, but with a different order cat, tiger, mouse because vector magnitude affects ranking.
When I am debugging retrieval, this is the checklist I use:
- Confirm the index metric first so
cosine,dotproductoreuclidean - Interpret scores using that metric’s scale (never as a default percentage)
- Compare top-k neighbors and read the chunks, not just the float values
- Only compare scores directly when they come from the same index and metric
Vector Database And Sample Data
Pinecone is one of many vector database solutions, it has a free cloud tier and is gaining popularity. Most corporate companys Ive worked for are on the PostgreSQL route, you can use this with the extension pgvector. Another option for POC or self hosting is SQLite which uses separate vector extensions such as sqlite-vec.
Many more exist. A few popular ones I see often in posts are Qdrant, Weaviate, Milvus and Elasticsearch
Then using the data from the post Principal Component Analysis PCA Reduction we can explain the retrieval techniques using simple CSV data with only two vectors per label. This would not be a real world use case but as explained in Retrieval Augmented Generation RAG (theory notes) 2D is the simplest to understand.
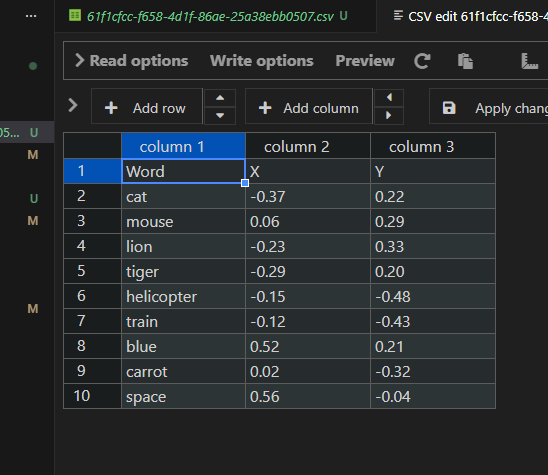
From the same post we can see this data plotted with groups starting to form, for the example to come I will then use lion as the query. So you can think of it as What is semantically simliar to 'lion'. Some useless and unrelated content, in my birth country the lion is known as ibhubesi - king of the beasts 🦁
Cosine Similarity
Now using the same vectors, but comparing directional alignment instead of absolute distance. The Cosine formula is cos(theta) = (lion . p) / (|lion| * |p|) with expanded form cos(theta) = (x_l*x_p + y_l*y_p) / (sqrt(x_l^2 + y_l^2) * sqrt(x_p^2 + y_p^2))
Im not a mathematician so for my simple brain the interpretation is
1: same direction0: perpendicular (at a 90-degree angle, like an L-shape)-1: opposite direction
So when looking for something simliar to lion you could plot all the values by lable as below.
| Label | Angle from lion (degrees) | Dot product (lion . p) |
p magnitude (norm of candidate vector) | Cosine similarity |
|---|---|---|---|---|
| lion | 0° | 0.1618 | 0.4022 | 1.000 |
| tiger | ~20° | 0.1327 | 0.3523 | * 0.937 |
| cat | ~24° | 0.1577 | 0.4305 | * 0.911 |
| mouse | ~46° | 0.0819 | 0.2961 | * 0.688 |
| blue | ~103° | -0.0503 | 0.5608 | -0.223 |
| helicopter | ~128° | -0.1239 | 0.5029 | -0.613 |
| space | ~129° | -0.1420 | 0.5614 | -0.629 |
| train | ~130° | -0.1143 | 0.4464 | -0.637 |
| carrot | ~149° | -0.1102 | 0.3206 | -0.854 |
* Top k most simliar, so when compared to lion the lables tiger,cat and mouse are most simliar.
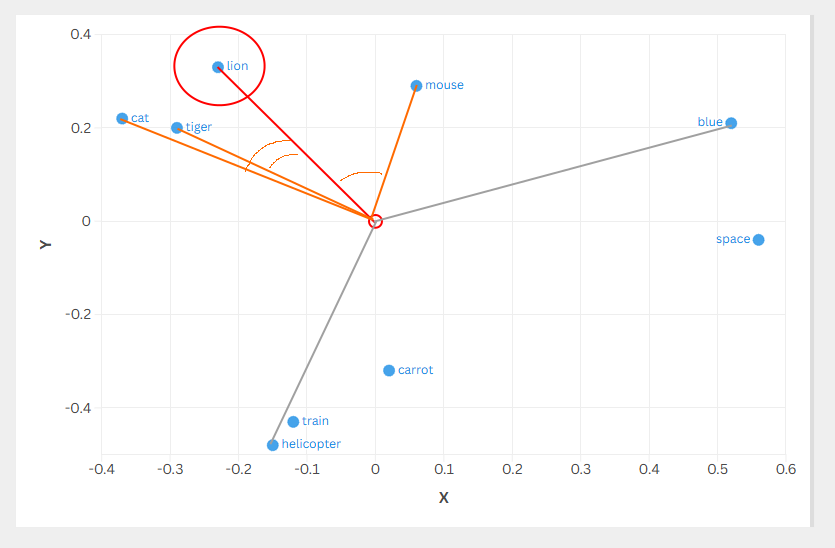
Pictures for my brain are simpler to understand, so in the chart below lion is the query vector and each vector is drawn as a ray from the origin (0,0): rays to tiger, cat, and mouse represent higher alignment (scores closer to 1), while rays to points like blue and helicopter represent lower or negative alignment.
Euclidean Distance
For this walkthrough, each label in the chart is a 2D vector (x, y), and I treat lion as the query point. So using the distance formula: d(lion, p) = sqrt((x_p - x_l)^2 + (y_p - y_l)^2) It is just the Pythagorean theorem in coordinate form which is horizontal offset and vertical offset define a right triangle, and distance is the hypotenuse.
| Label | x | y | delta x | delta y | Distance |
|---|---|---|---|---|---|
| lion | -0.23 | 0.33 | 0.00 | 0.00 | 0.000 |
| tiger | -0.29 | 0.20 | -0.06 | -0.13 | * 0.143 |
| cat | -0.37 | 0.22 | -0.14 | -0.11 | * 0.178 |
| mouse | 0.06 | 0.29 | 0.29 | -0.04 | * 0.293 |
| carrot | 0.02 | -0.32 | 0.25 | -0.65 | 0.696 |
| blue | 0.52 | 0.21 | 0.75 | -0.12 | 0.760 |
| train | -0.12 | -0.43 | 0.11 | -0.76 | 0.768 |
| helicopter | -0.15 | -0.48 | 0.08 | -0.81 | 0.814 |
| space | 0.56 | -0.04 | 0.79 | -0.37 | 0.872 |
* Nearest neighbors by Euclidean distance from lion are tiger,cat and mouse.
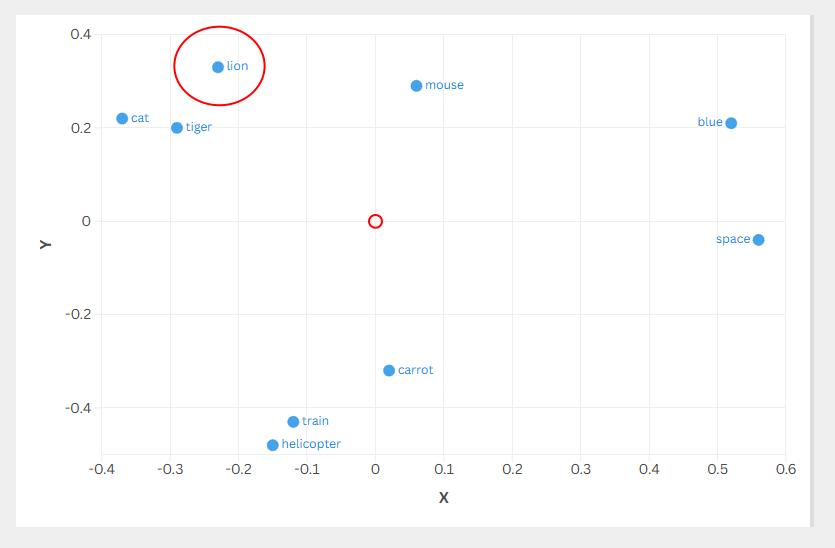
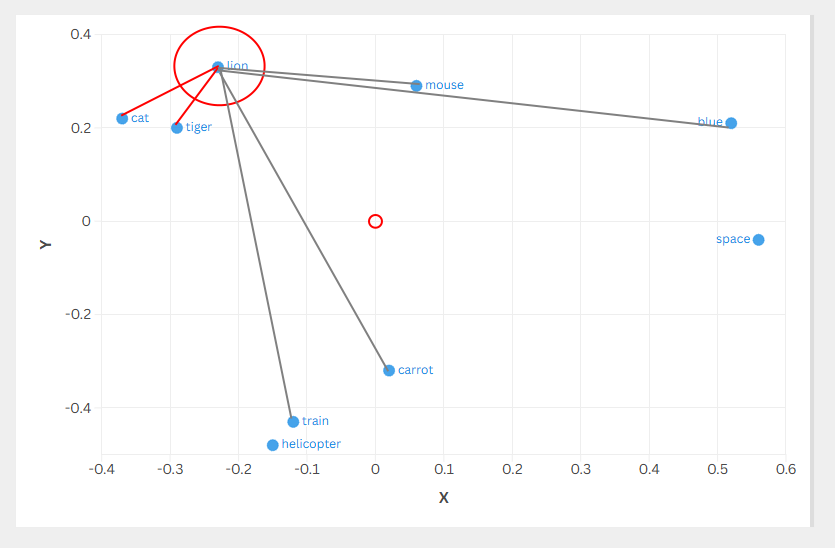
Again, pictures for my brain are simpler to understand, so in the chart below each comparison is the line segment from lion to another point (not rays from the origin), and the shorter segments are the nearer neighbors by Euclidean distance.
Dot Product
Now using the same vectors again, but this time using raw dot product without normalization. The Dot product formula is dot(lion, p) = x_l*x_p + y_l*y_p
Quick interpretation:
- Bigger positive number: more aligned and/or larger magnitude
- Around
0: weak alignment - Negative: mostly opposite direction
| Label | x | y | Magnitude | Rank | Dot product (lion . p) |
|---|---|---|---|---|---|
| lion | -0.23 | 0.33 | 0.4022 | 1 | 0.1618 |
| cat | -0.37 | 0.22 | 0.4305 | 2 | * 0.1577 |
| tiger | -0.29 | 0.20 | 0.3523 | 3 | * 0.1327 |
| mouse | 0.06 | 0.29 | 0.2961 | 4 | * 0.0819 |
| blue | 0.52 | 0.21 | 0.5608 | 5 | -0.0503 |
| carrot | 0.02 | -0.32 | 0.3206 | 6 | -0.1102 |
| train | -0.12 | -0.43 | 0.4464 | 7 | -0.1143 |
| helicopter | -0.15 | -0.48 | 0.5029 | 8 | -0.1239 |
| space | 0.56 | -0.04 | 0.5614 | 9 | -0.1420 |
* Most similar by dot product with lion as the query are cat,tiger and mouse
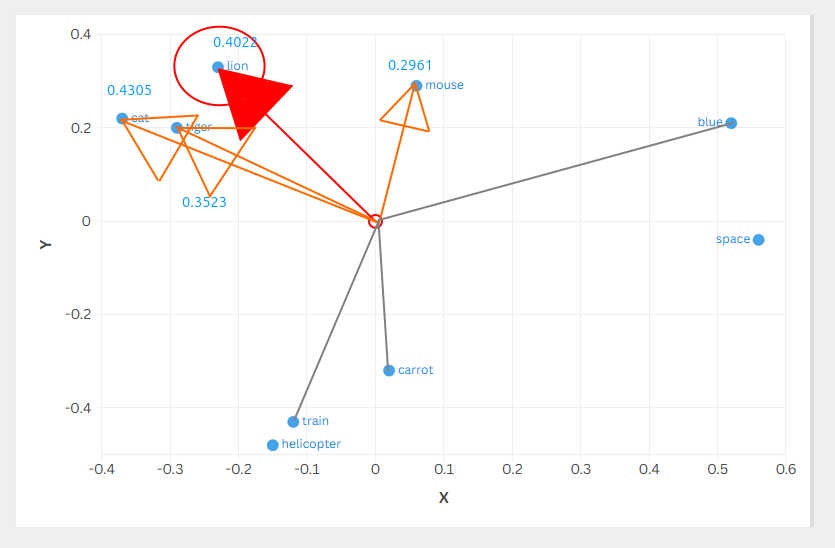
Unlike cosine similarity (which normalizes by magnitude), dot product cares about both direction and magnitude. In the chart below, arrow length represents magnitude, which is why you can see cat (0.4305) has a longer arrow than tiger (0.3523), that extra magnitude is why cat ranks #2 instead of tiger at #3, even though they point in similar directions. Mouse has good direction but its tiny magnitude (0.2961) hurts its ranking. Meanwhile space and blue have the longest arrows but point away from lion, so their magnitude works against them. It’s direction times magnitude: bigger arrows pointing the right way win, smaller arrows or wrong directions lose.