Over time applications that persist data to a store will have performance degradation as queries that used to return in milliseconds may now take seconds or even minutes to return. This is normal as the application grows and it actually gets used.
MySQL Community edition and MySQL Workbench come with all the tools (for free) needed to speed things up, you just need to know where to look and its not actually that hard.
Where Clause
Assuming your SQL commands have a where clause they can be optimized to use an index, this is just a sorted list the database engine will query first when fetching your data.
The WHERE clause tells the engine you only want a subset of the data. Without a WHERE and the subsequent operators like AND, OR ect, you will always request all of the data.
Large Tables
A school boy mistake would be to simply add indexes to all tables and columns, although the engine will ignore an index if it decides its not needed, the index will need to be maintained and updated over time. It will become fragmented.
Following YAGNI (You aren’t gonna need it) seems to work pretty well for me as I would rather speed up SQL Commands when they start becoming a problem.
The statment below can help you identify tables to focus on, count_rows and index_fragmented are good starting points.
1 | SELECT CONCAT(table_schema, '.', table_name) as table_schema, |
Slow Query Log
The engine will not log these by default for performance reasons, you need to switch this on. You can find all system variables with SHOW VARIABLES. The statement below filters only variables realted to slow queries.
1 | SHOW VARIABLES where variable_name |
The defaults for these will be
1 | log_output ~ FILE |
You can also do things like SHOW VARIABLES where variable_name like '%query%';.
Although you could query that file with something like tail MACHINENAME-slow.log, I like to use SQL to keep the logs as its easier to digest. If your database is runnnig in a container you can create an Interactive Container Session and connect to its terminal.
If you using SQL to keep the logs, update as follows:
1 | SET GLOBAL slow_query_log = 'ON'; |
long_query_time
The 1 above means one second, you can however use milliseconds:
1 | SET long_query_time = 0.1; ~ 100ms |
Then clear the logs table so you start fresh:
1 | TRUNCATE mysql.slow_log |
Then test a long running query and check the results:
1 | SELECT SLEEP(2); |
Now run your application and let the engine log the slow queries for you.
Execution Plans
Pluck out a slow query from the above and run it in MySQL Workbench, to the right of the results scroll down and click Execution Plan. Things to look out for are Full Table Scan (This will be red) and Thick lines (shows heaps of rows/data coming back)
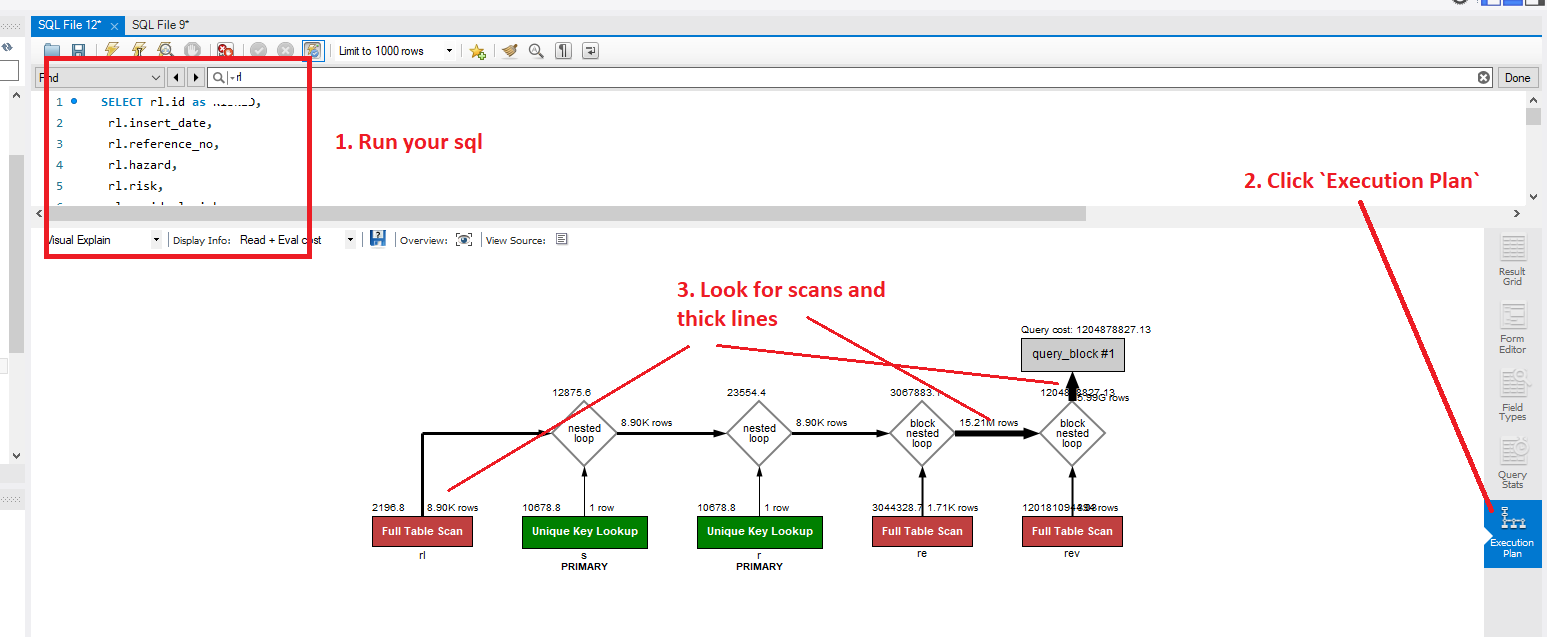
Full Table Scan
You could fix this with an index, check which columns are in the WHERE statement or the columns you are using in your JOINS
Thick lines
This is a bit harder, look at the amount of data being returned - do you need it? This can be fixed with simple things like swapping out LEFT OUTER JOIN with INNER JOIN as the inner returns only data where they intersect. This is not a silver bullet, your application may NEED all this data!
An index CAN however fix this for you so you will need to experiment and possibly re-write some of the queries.
- https://dev.mysql.com/doc/workbench/en/wb-tutorial-visual-explain-dbt3.html
- https://dev.mysql.com/doc/refman/8.0/en/execution-plan-information.html
- https://dev.mysql.com/doc/refman/8.0/en/explain.html
- https://dev.mysql.com/doc/workbench/en/wb-performance.html
Create Index
This can be as simple as CREATE INDEX [your index name] ON [your table name] ([your column name]). Its best to find a naming convention and stick to it, the examples below are prefixed with idx_ for index and then the column name.
1 | CREATE INDEX idx_id |
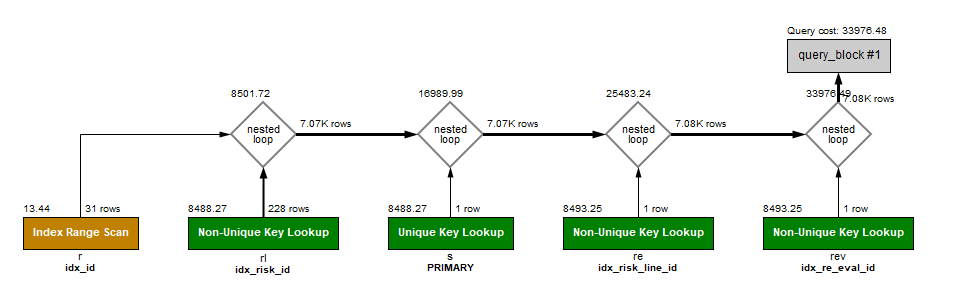
After creating the index, run the query again and click the Execution Plans to confirm if your change helped. Instead of SCAN you should hopefully see SEEK, no more/or less red and thin lines showing less data.
You may still see SCAN like below but if the rows are low its probably fine.
If you make a mistake you can DROP the index
1 | DROP INDEX idx_risk_id ON risk_line; |
- https://dev.mysql.com/doc/refman/8.0/en/create-index.html
- https://dev.mysql.com/doc/refman/8.0/en/mysql-indexes.html
Other logging
If the slow querys doesnt help you can enable verbose logging. Check the current settings with:
1 | SHOW VARIABLES where variable_name |
The defaults for these will be
1 | general_log ~ OFF |
Then update them as:
1 | SET global general_log = 'ON'; |
Then truncate the table
1 | TRUNCATE mysql.general_log |
Run the application or some SQL commands and see what it logged:
1 | select * from mysql.general_log; |