I needed a way to performance tune a Postgresql database focusing on a simple table and select statement. I did this locally using Docker, PgAdmin and a blank table.
This is simliar to MySQL Performance and SQL Execution Plans.
Local setup
- Use the postgres docker image to run a local instance
1 | docker run -d -p 5432:5432 -e POSTGRES_USER=myuser -e POSTGRES_PASSWORD=mypassword -e POSTGRES_DB=mydatabase -e POSTGRES_SCHEMA=myschema --name my-postgres postgres:17.4 |
Create a test table, here I copied Milans example and created in
pgtest.mydatabase.public.user_notes
1 | CREATE TABLE user_notes ( |
- Based on Generate Random Data create 1,000,000 records, on my machine this took
22 secondsto complete
1 | -- PostgreSQL uses DECLARE within a DO $$ ... $$ block (an anonymous code block) to declare variables. |
- Note the data halfway, this is useful later based on the data access patterns, its almost like I knew how the data was going to be accessed ahead of time 💩
1 | NOTICE: 450000 |
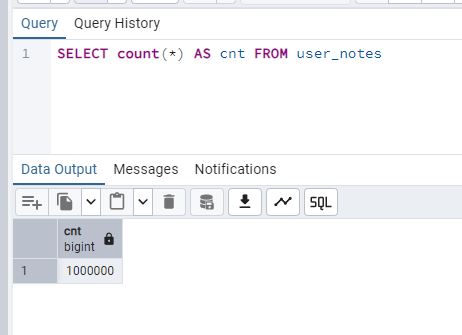
- Confirm the data exists
Count and expect 1,000,000
1 | SELECT count(*) AS cnt FROM user_notes |
Identify data access patterns
- Here Im just using the same SQL command Milan was using for his cursor example and the predicate values from my data seeding above
1 | SELECT id, date, note, user_id |
Analyze
There are a few ways to analyze the query
Visually
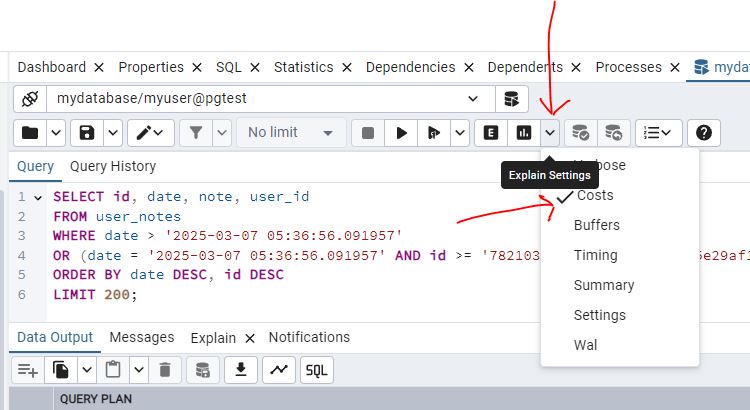
- Under
Explain SettingsCheckCosts. The cost is not a time measurement, its just a number that represents the effort to run the query where lower is good. If you have a complex query, you would look at the cost per step and then focus on the highest cost.
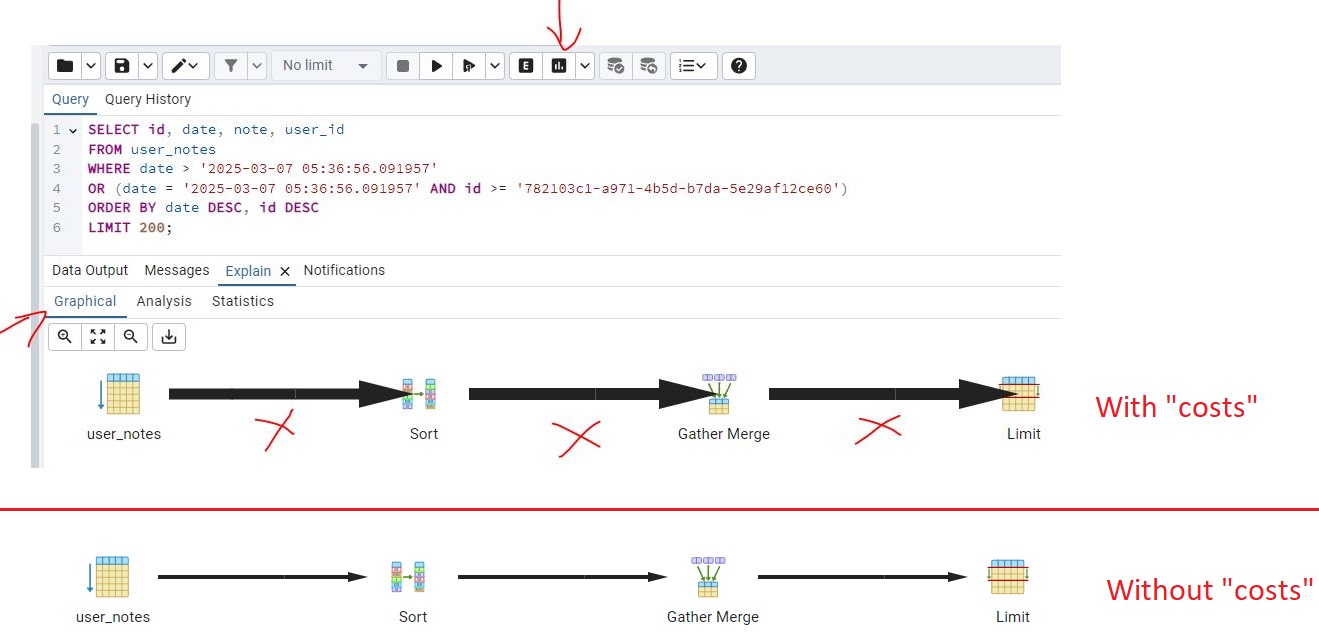
- Select
Explain Analyze, then clickGraphical, the thick lines are indicative of inefficiency, this is a simple example but for more complex commands they could help you pin point where to start looking first. If you de-selectCostsfrom step 1 and run again you will notice the lines are skinny.
So I guess SQL is telling us if we are too fat we will be slow? Thats not very nice! 🤬
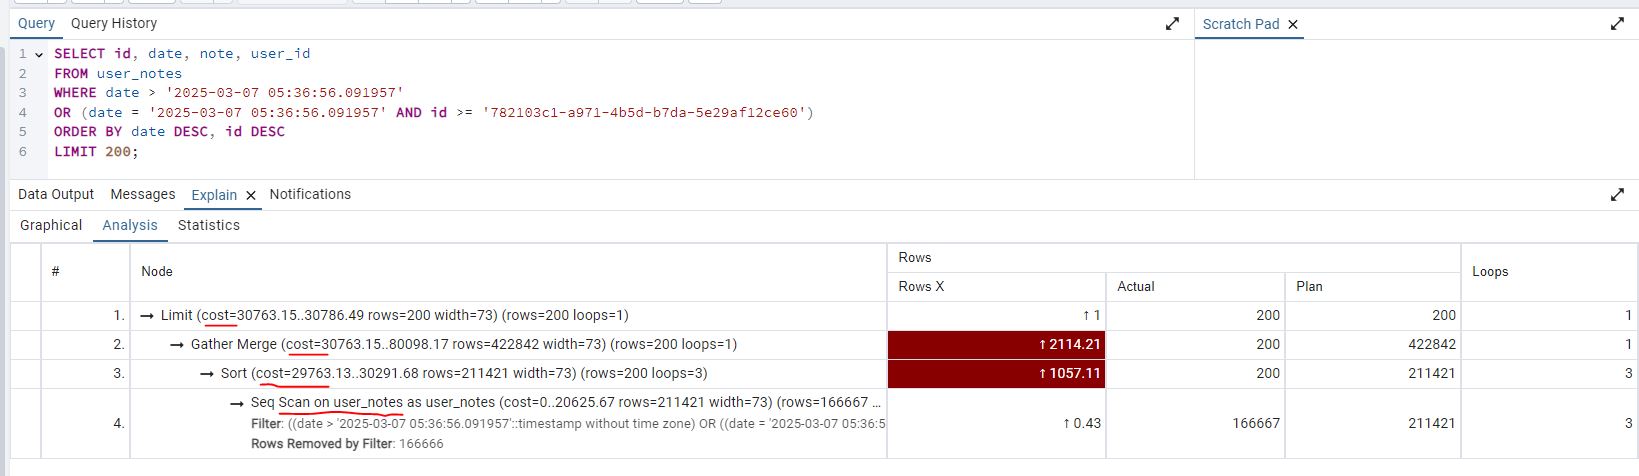
- Selecting
Analysisyou can see the cost per step, a table scan on user_notes is bad, this means its scanning the whole table. Generally a seek is more efficient.
Explain Analyze
- Just add
EXPLAIN ANALYZEto the beginning of the SQL command and execute the script. The SQL command should look like the below:
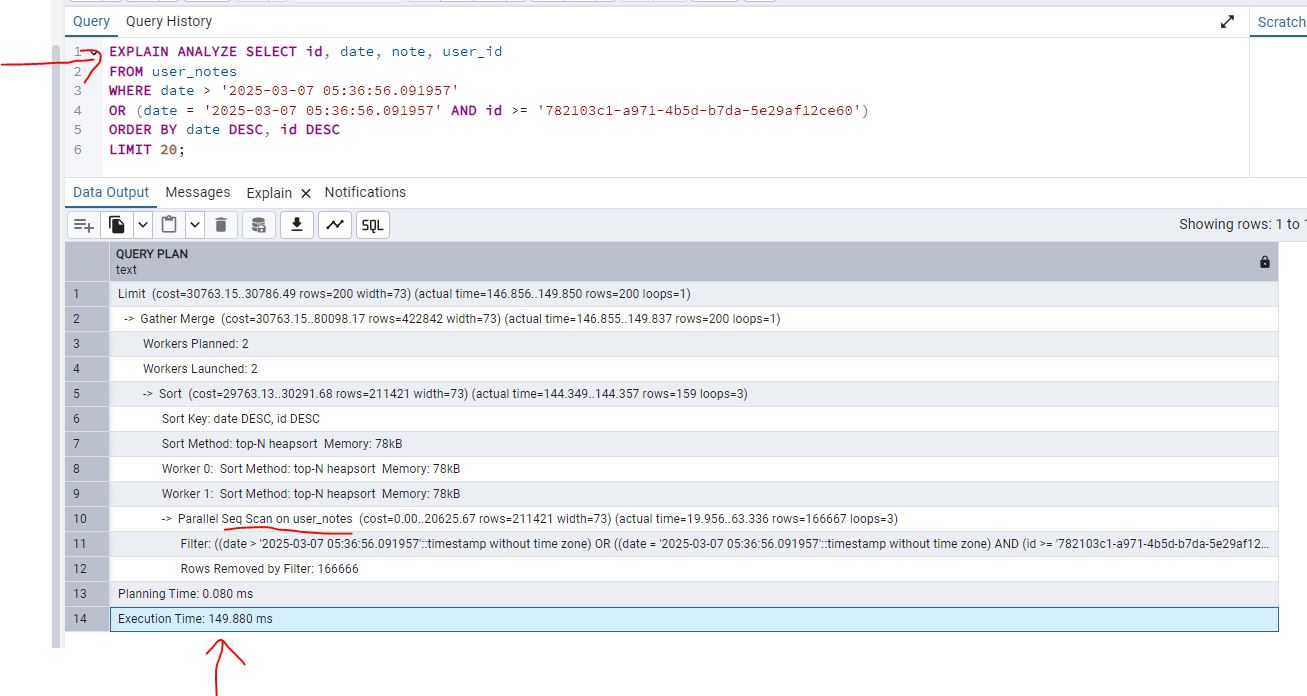
1 | EXPLAIN ANALYZE SELECT id, date, note, user_id |
- Looking at the results, the execution time is
149.880 ms. Also same as the above, you can see a table scan on user_notes which is bad.
Adding an index
Based on the contrived example above and seeing what Milan did, its clear we need an index on date and id with the same sorting. An index is just a sorted table that will point to the data. Its bad to index every column because there is a performance hit, everytime you insert or delete, the index becomes more fragmented.
1 | CREATE INDEX idx_user_notes_date_id ON user_notes (date DESC, id DESC); |
Analyze (with index)
Life is better with an index :)
Visually (with index)
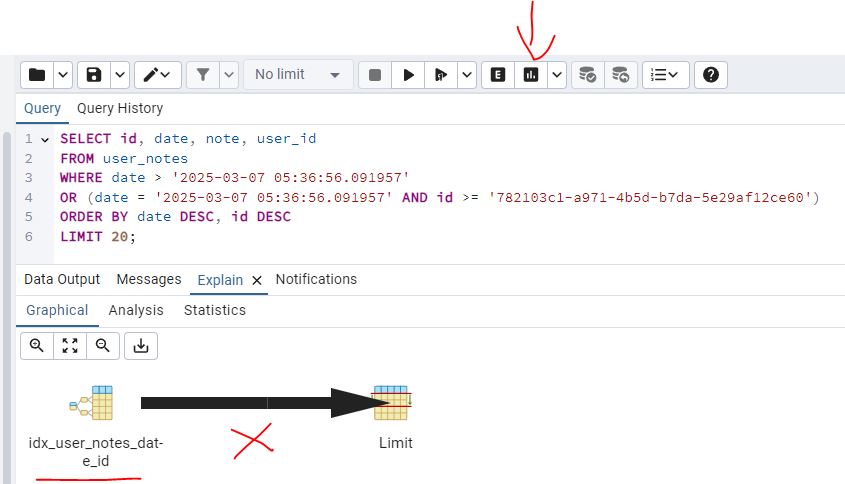
- Remember that under
Explain Settingsto checkCosts, then running the SQL command withExplain Analyzeand clickGraphical. You will now see idx_user_notes_date_id is being used, there is still a tick line for the limit, indexes are not a silver bullet :)
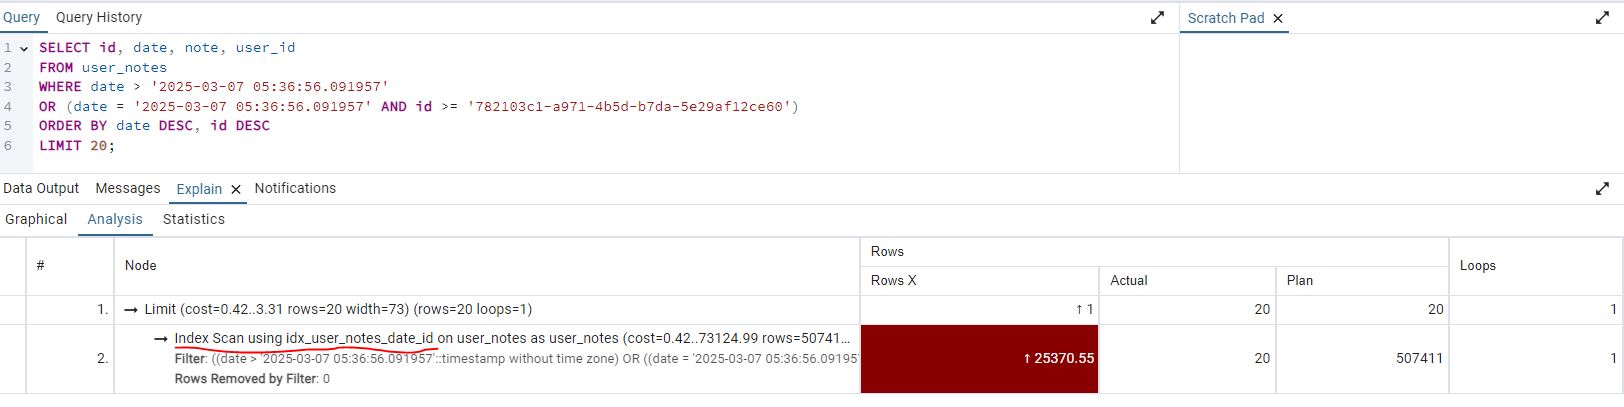
- Selecting
Analysisyou can now see a scan using the index, this is better
Explain Analyze (with index)
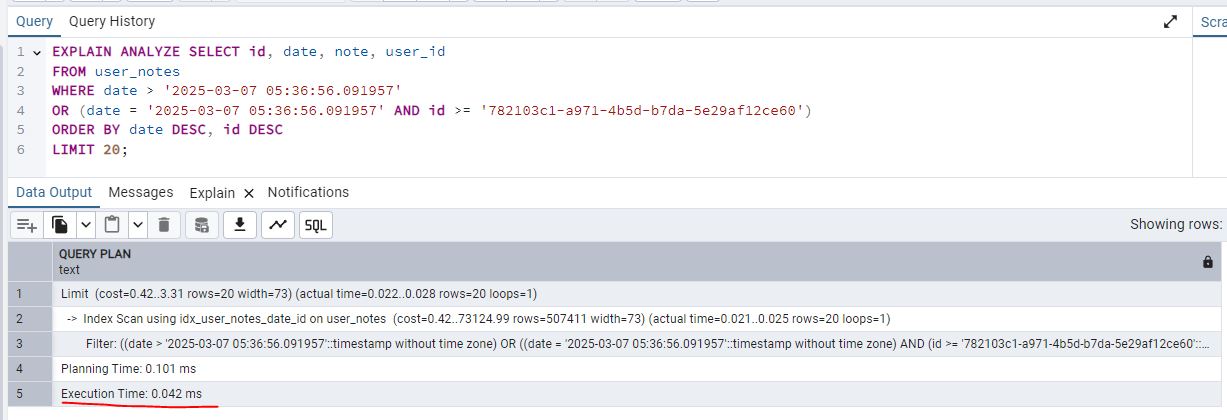
- Same as above add just add
EXPLAIN ANALYZEto the beginning of the SQL command and execute the script, this time the execution time is0.042 ms
- So if you compare the speed gain with and without the index, its night and day!
1 | 0.042 ms -> with index |