1
2
3
4
5
6
7
8
9
10
11
12
13
14
15
16
17
18
19
20
21
22
23
24
25
26
27
28
29
30
31
32
33
34
35
36
37
38
39
40
41
42
43
44
45
46
47
48
49
50
51
52
53
54
55
56
57
58
59
60
61
62
63
64
65
66
67
68
69
70
71
72
73
74
75
76
77
78
79
80
81
82
83
84
| import React, { useRef, useCallback } from 'react';
import {
Chart as ChartJS,
CategoryScale,
BarElement,
Title,
Tooltip,
Legend,
} from 'chart.js';
import { Bar } from 'react-chartjs-2';
import { faker } from '@faker-js/faker';
ChartJS.register(
CategoryScale,
LinearScale,
BarElement,
Title,
Tooltip,
Legend
);
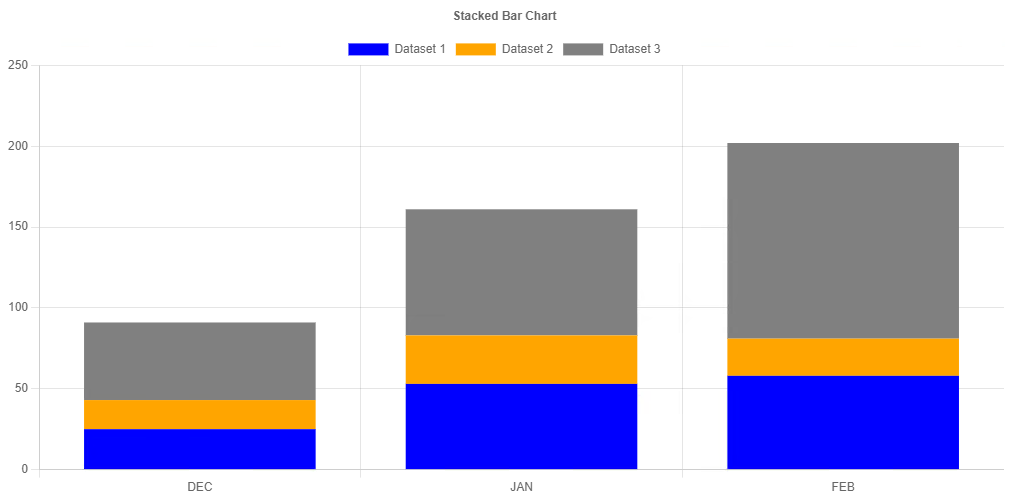
export const options = {
plugins: {
title: {
display: true,
text: 'Stacked Bar Chart',
},
},
responsive: true,
scales: {
x: {
stacked: true,
},
y: {
stacked: true,
},
},
};
const labels = ['January', 'February', 'March', 'April', 'May', 'June', 'July'];
export const data = {
labels,
datasets: [
{
label: 'Dataset 1',
data: labels.map(() => faker.random.numeric()),
backgroundColor: 'rgb(255, 99, 132)',
},
{
label: 'Dataset 2',
data: labels.map(() => faker.random.numeric()),
backgroundColor: 'rgb(75, 192, 192)',
},
{
label: 'Dataset 3',
data: labels.map(() => faker.random.numeric()),
backgroundColor: 'rgb(53, 162, 235)',
},
],
};
const StackedBarChart = () => {
let ref = useRef(null);
const download = useCallback(() => {
const link = document.createElement('a');
link.download = 'StackedBarChart.png';
link.href = ref.current.toBase64Image();
link.click();
}, []);
return (
<div>
<button type="button" onClick={download}>
Download Stacked Bar Chart
</button>
<Bar ref={ref} options={options} data={data} />;
</div>
);
};
export default StackedBarChart;
|