
Log parser is a powerful tool by Microsoft that can be used to import log files from several applications. In the past I have found it extremely useful when debugging IIS (Internet Information Services) logs for an array of issues including slow web page response to memory leaks.
Log parser is a powerful, versatile tool that provides universal query access to text-based data such as log files, XML files and CSV files, as well as key data sources on the Windows® operating system such as the Event Log, the Registry, the file system, and Active Directory®.
For this article I will focus on importing and manipulating IIS logs. I assume you have access to the webserver, have installed Log Parser, SQL Server express and SQL Server Management studio. If you have not please see “References” below for download links.
Locate IIS log files
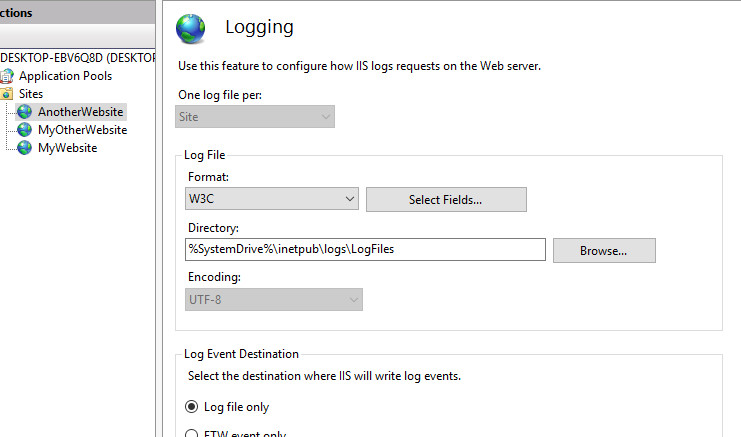
By default the IIS logs are stored on the webserver in W3C format in the location %SystemDrive%\inetpub\logs\LogFiles\
This can be checked from IIS by selecting the “host instance” and then double clicking on “Logging”
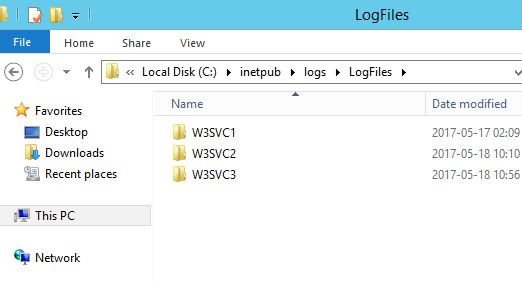
The folders inside “LogFiles” correspond to the site instance ID which can be checked by selecting “Sites” then the “Site Name” and selecting “Advanced Settings…”
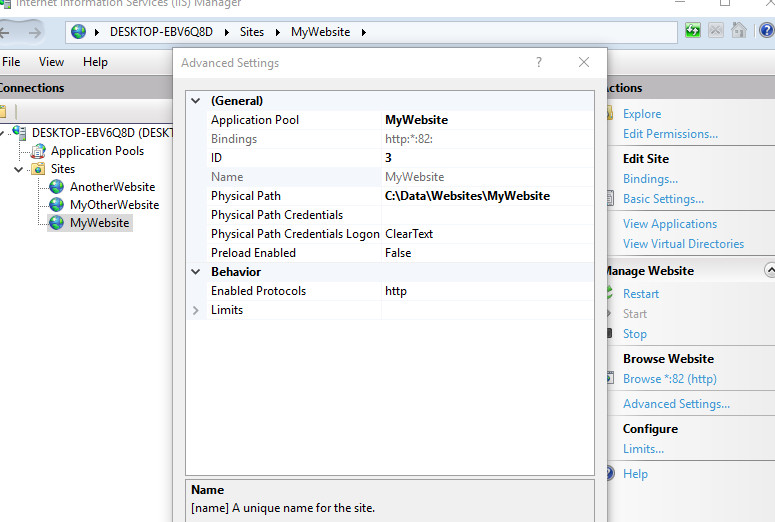
For the above example the folder would be “W3SVC3” where “VC3” matches the ID 3. The files inside the folder are then stored by date stamp yyMMdd
Import Logs
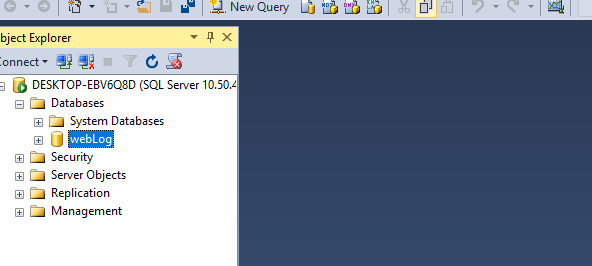
Firstly create the SQL database webLog on your local instance, the import will automatically create the tables for you if you include the -createTable:ON parameter.
You can add Log Parser to your environmental variables or simply run it from “C:\Program Files (x86)\Log Parser 2.2”. I prefer to copy the files one at a time to the above location and run the import from command prompt. Once I’m done I delete the .log file to avoid confusion.
For the below example I copied “u_ex161129.log” to C:\Program Files (x86)\Log Parser 2.2” from the webserver at “C:\inetpub\logs\LogFiles\W3SVC3”
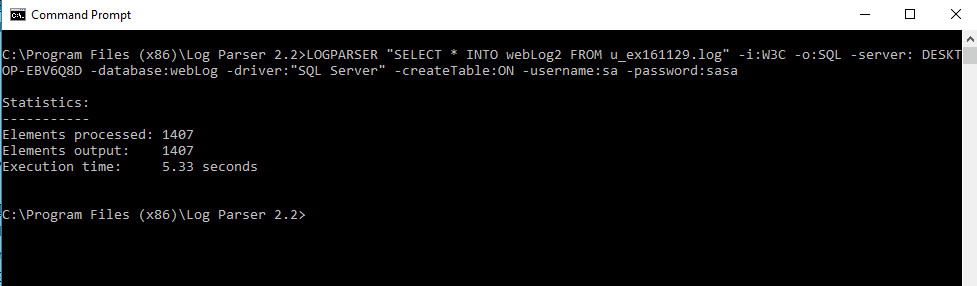
The import command would then be:
1 | LOGPARSER "SELECT * INTO webLog2 FROM u_ex161129.log" |
The successful import will then show statistics of elements processed and execution time.
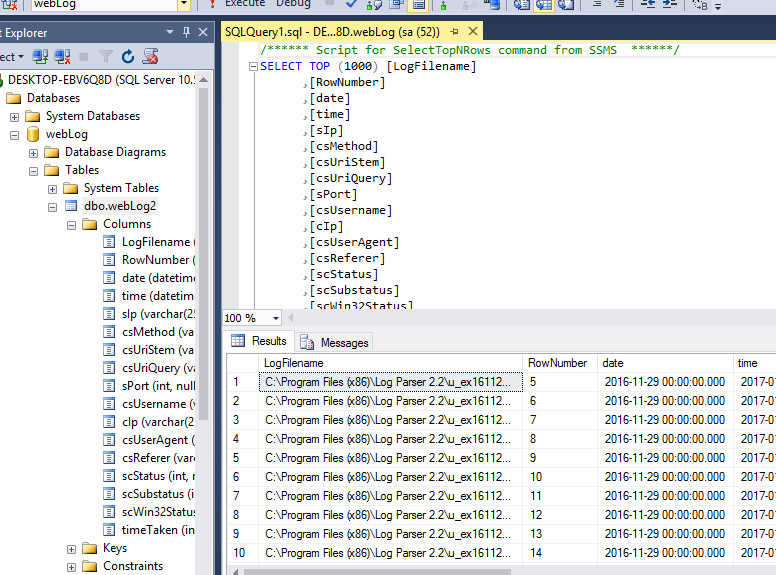
The data can then be seen in SQL Management Studio
Query data by status code
From here you can check the status codes and their counts by date. This can help you determine pages or elements such as images that your site is having issues with.
Examples:
404 Not Found
The server has not found anything matching the Request-URI. No indication is given of whether the condition is temporary or permanent. The 410 (Gone) status code SHOULD be used if the server knows, through some internally configurable mechanism, that an old resource is permanently unavailable and has no forwarding address. This status code is commonly used when the server does not wish to reveal exactly why the request has been refused, or when no other response is applicable.
500 Internal Server Error
The server encountered an unexpected condition which prevented it from fulfilling the request.
Sample SQL statement to sort by status:
1 | SELECT |
Sample results
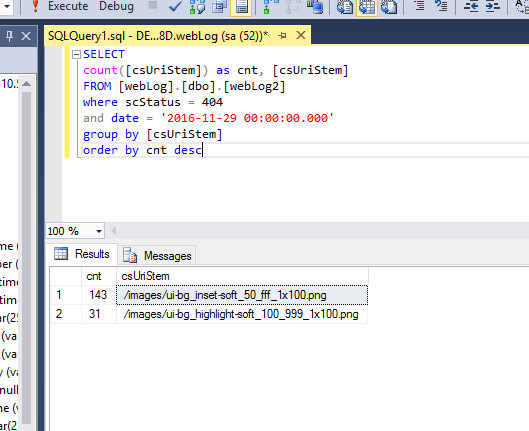
This means the code looked for “/images/ui-bg_inset-soft_50_fff_1x100.png” 143 times and error 404 file not found was returned.
The above can be repeated for server error 500 but additional information such as the query string can be helpful
1 | SELECT |
This would then show pages that are broken or break under different conditions. You can also use the timeTaken field to understand how long a page is taking to break or even time out.
Query data by execution time
As mentioned above you can query the logs to see how long pages are taking to respond, this is helpful for pages that work but users complain it takes a long time to respond. Often you will get tasks such as “The website is slow” which is not very helpful so you need to figure things out for yourself.
Sample SQL statement:
1 | SELECT |
Sample results:
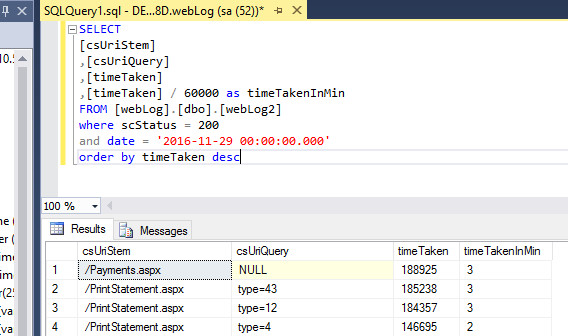
From the above results you can see that “/Payments.aspx” is the slowest page for the period taking 3 minutes to respond with status 200. It’s not broken, it’s just slow – so you may need to optimize your code or possibly index the database.
The second slowest page is /PrintStatement.aspx with the query string type=43 this means you can debug this page with these parameters to see why it takes 3 minutes to respond.
I hope this article is useful to other software developers trying to make sense of their IIS logs. If anybody has other tips or advice on how to query the imported data please comment below.